Sustainability Mission
Every tote we save from the landfill is a win for the planet. Here is how we turn that belief into measurable action, every single day.
Why It Matters
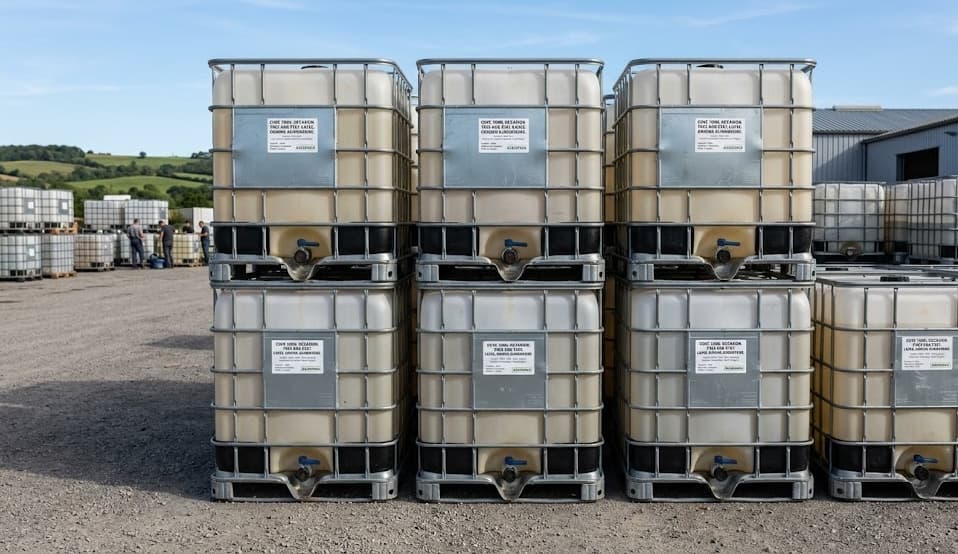
The Hidden Environmental Cost of IBC Totes
An intermediate bulk container is one of the most resource-intensive packaging formats in industrial use. Each standard 275-gallon tote contains roughly 130 pounds of high-density polyethylene, a galvanized steel cage, a wooden or plastic pallet, and multiple metal and rubber fittings. Manufacturing one from scratch requires significant petroleum, energy, water, and carbon emissions.
Yet the majority of IBC totes are used just once and discarded. In the United States alone, an estimated 1.5 million totes enter landfills each year. The environmental cost is enormous, but it is also entirely preventable. That is where IBC West Coast comes in.
Our Approach
Three Pillars of Sustainability
Reduce Virgin Material Demand
Every reconditioned tote we sell is one less container that needs to be manufactured from raw petroleum and steel. By extending the service life of existing totes, we directly reduce the demand for virgin HDPE plastic, lowering the environmental cost at the very start of the supply chain.
of plastic saved per tote reused
less energy vs. manufacturing new
Reuse Through Quality Reconditioning
Our multi-stage reconditioning process includes triple-rinse cleaning, pressure testing, valve replacement, and exterior inspection. Each tote is restored to a condition that meets or exceeds industry standards, giving it a second, third, or even fourth life cycle.
average reuse cycles per tote
of incoming totes pass reconditioning
Recycle What Cannot Be Reused
When a tote has reached the end of its usable life, we do not send it to the landfill. We disassemble it into component materials. HDPE bottles are chipped and sold to plastic recyclers. Steel cages go to metal scrap processors. Wooden pallets are repaired or chipped for mulch. Even valves and gaskets are sorted for material recovery.
landfill rate — our zero-waste pledge
CO₂ prevented annually
By The Numbers
Our Environmental Impact
Real numbers from our real operations. These figures represent the cumulative impact of IBC West Coast's recycling and reconditioning programs.
IBC Totes Processed Per Year
Tons of CO₂ Prevented Annually
Pounds of Plastic Diverted from Landfill
Material Recovery Rate
Gallons of Water Conserved
kWh of Embedded Energy Saved
Closing the Loop
The Circular Economy in Action
The traditional IBC lifecycle is linear: manufacture, use, discard. At IBC West Coast, we replace that straight line with a circle. Used totes come into our facility, are inspected and cleaned, and go back out to a new user. When they eventually wear out, we break them down into raw materials that feed back into the manufacturing cycle.
This circular model means that the materials used to build an IBC tote remain in productive use for as long as physically possible. HDPE plastic does not degrade with reconditioning. Steel cages can be straightened and reinforced. Even worn-out bottles can be chipped and remolded into non-food-grade products.
The result is a system where virtually nothing goes to waste. And because reusing and recycling requires far less energy than virgin manufacturing, the environmental savings compound with every cycle.
Collect
Surplus totes picked up from businesses
Inspect
Multi-point quality assessment and grading
Clean
Triple-rinse, pressure test, sanitize
Recondition
New valves, labels, and repairs as needed
Resell
Quality totes delivered to new users
Recycle
End-of-life materials recovered and reprocessed
Our Pledges
Environmental Commitments
Sustainability is not a side project for us. These commitments are embedded in our daily operations and measured against real targets.
Zero-Landfill Processing
We have committed to sending zero IBC-related materials to landfill. Every component of every tote we handle is either reused, recycled, or repurposed into secondary materials.
Carbon-Conscious Logistics
Our fleet routes are optimized to minimize empty-mile driving. We schedule pickups and deliveries along consolidated corridors to reduce fuel consumption and emissions per tote moved.
Chemical-Free Cleaning Options
We offer water-based, biodegradable cleaning processes for clients who want to minimize chemical use. Our triple-rinse system uses reclaimed water wherever possible.
Transparent Reporting
We provide clients with sustainability impact reports showing the exact environmental savings from their IBC tote reuse. These reports support ESG disclosures and green procurement targets.
Supplier Standards
We hold our own suppliers and recycling partners to strict environmental standards. Materials leaving our facility go only to certified, responsible processors.
Continuous Improvement
We track our environmental performance metrics monthly and set annual improvement targets. Every year, we aim to increase our recovery rate, reduce our water usage, and lower emissions per tote processed.
See Your Impact
Calculate Your Environmental Savings
Use the calculator below to see how choosing reconditioned totes over new ones translates into real environmental savings for your business.
Eco Impact Calculator
See how many resources you save by choosing reconditioned IBC totes instead of buying new.
* Estimates based on EPA data for HDPE container lifecycle analysis.
Transparency in Action
Annual Environmental Impact Report
We believe in full transparency about our environmental performance. Below is a detailed breakdown of our impact metrics for the most recent reporting year, organized by category.
Materials Processed
Material Recovery
Environmental Savings
Our overall material recovery rate for the reporting year was 98.2%, meaning less than 2% of all IBC materials that entered our facility ended up in any waste stream. The remaining 1.8% consists primarily of adhesive residues, severely contaminated label materials, and fragments too small for efficient separation. We are actively working to reduce this figure below 1% through improved sorting technology and new recycling partnerships.
Climate Action
Carbon Footprint Reduction
Every reconditioned tote represents a significant carbon saving. Here is exactly where those savings come from and how we measure them.
Carbon Cost of a New IBC Tote
Carbon Cost of a Reconditioned Tote
Net Savings: 92 lbs CO₂ Per Tote
That is a 79% reduction in carbon emissions compared to manufacturing a brand-new container from virgin materials.
10 totes
= 920 lbs CO₂ saved
100 totes
= 4.6 tons CO₂ saved
1,000 totes
= 46 tons CO₂ saved
Our carbon calculations are based on lifecycle analysis (LCA) data from published studies on HDPE production, steel manufacturing, and transportation emissions factors from the EPA SmartWay program. We use the GHG Protocol Corporate Standard methodology for categorizing emissions into Scope 1 (direct fleet emissions), Scope 2 (purchased electricity), and Scope 3 (upstream materials and downstream logistics). Our solar array offsets approximately 35% of Scope 2 emissions, and our route optimization program has reduced Scope 1 emissions per tote moved by 28% since 2021.
We are working toward having our carbon calculations independently verified by a third-party auditor aligned with ISO 14064 standards. This will give clients additional confidence in the accuracy of the environmental impact data we include with every order. Verified carbon offset data can be directly incorporated into corporate Scope 3 reporting under the GHG Protocol, supporting ESG disclosure requirements for publicly traded companies and those subject to climate reporting mandates.
Every Drop Counts
Water Conservation Practices
Cleaning IBC totes requires water, but we have engineered our systems to minimize consumption and maximize reuse. Here is how our water conservation program works.
Closed-Loop Wash System
Our primary wash bays use a closed-loop water recirculation system that recovers over 80% of the water used in each cleaning cycle. The recirculation system includes three treatment stages: coarse particulate filtration to remove physical debris, activated carbon adsorption to capture dissolved organic compounds, and UV sterilization to eliminate bacterial contamination. The treated water is continuously monitored for pH, turbidity, and conductivity to ensure it meets our internal cleaning standards before being recirculated.
Rainwater Harvesting
Our Hayward facility features a rainwater collection system that captures runoff from the 25,000 sq ft warehouse roof. Collected water is stored in a 5,000-gallon tank, filtered through a sand-and-carbon treatment system, and used for initial rinse cycles and general facility cleaning. During the rainy season (November through April), this system provides up to 20% of our total cleaning water needs, reducing our draw on municipal water supplies during the wettest months.
Low-Flow Equipment Upgrades
All wash nozzles, pressure washers, and rinse stations have been upgraded to high-efficiency models that deliver equivalent cleaning power at reduced flow rates. Automated shut-off valves on every wash bay prevent water waste when bays are not actively in use. Timer-controlled rinse cycles ensure that totes receive exactly the amount of water needed for their contamination level, rather than running a one-size-fits-all cycle. These upgrades have cut per-tote water consumption by 35% since we began tracking in 2020.
Wastewater Treatment and Discharge
Water that cannot be recirculated is treated through our on-site wastewater processing system before discharge. This system includes oil-water separation, chemical neutralization for pH adjustment, and final filtration to remove suspended solids. All discharge is monitored and tested to ensure compliance with our industrial wastewater permit under the Clean Water Act. We maintain detailed discharge records that are available for regulatory inspection at any time.
Water Usage Summary (Annual)
1.8M gal
Total water used
1.44M gal (80%)
Water recirculated
~120K gal
Rainwater captured
~240K gal
Freshwater from municipal
Tracking Progress
Waste Diversion Metrics Year Over Year
Our environmental impact grows every year as we expand operations and improve processes. Here is a five-year view of our waste diversion performance.
| Year | Totes Processed | Plastic Diverted (lbs) | Steel Recycled (lbs) | Recovery Rate | Landfill Rate |
|---|---|---|---|---|---|
| 2020 | 6,200 | 806,000 | 279,000 | 95.2% | 4.8% |
| 2021 | 7,800 | 1,014,000 | 351,000 | 96.1% | 3.9% |
| 2022 | 9,500 | 1,235,000 | 427,500 | 97.0% | 3.0% |
| 2023 | 10,800 | 1,404,000 | 486,000 | 97.6% | 2.4% |
| 2024 | 12,400 | 1,612,000 | 558,000 | 98.2% | 1.8% |
Five-Year Cumulative Impact
46,700
Total Totes Processed
6.07M lbs
Plastic Diverted from Landfill
2.1M lbs
Steel Recycled
3,950 tons
Cumulative CO2 Prevented
Forward Looking
Sustainability Goals for 2026-2027
We set ambitious, measurable goals for our environmental performance and hold ourselves accountable to delivering on them. Here are our targets for the next two years.
Achieve 99% Material Recovery Rate by End of 2027
Current: 98.2%We will invest in improved sorting technology for small-fraction materials (adhesive residues, label fragments, and mixed plastics under 2 inches). A new optical sorting system is being evaluated that can separate materials by resin type with over 95% accuracy. We are also partnering with a specialized adhesive recycler who can process the tape and label residues that currently constitute the majority of our non-recovered waste stream.
Reduce Freshwater Consumption by 15% Per Tote
Current: ~145 gallons per tote (including recirculated water)We will expand our rainwater harvesting capacity from 5,000 to 10,000 gallons, upgrade our closed-loop filtration system to enable a fourth recirculation cycle, and implement moisture-sensing controls on our rinse stations that automatically adjust water volume based on the contamination level detected during the initial spray. The combined effect is projected to reduce freshwater consumption from municipal sources to under 20 gallons per tote.
Reach 50% On-Site Renewable Energy by 2028
Current: 35% from rooftop solarWe are expanding our solar array from 120 kW to 200 kW by adding panels to the newly extended warehouse roof section. We are also evaluating battery storage systems that would allow us to use solar-generated electricity during evening wash shifts. The combination of expanded solar capacity and storage is projected to offset 50% or more of our total grid electricity consumption by the end of 2028.
Process 20,000 Totes Annually by 2027
Current: 12,400 per yearOur second facility in the Pacific Northwest will absorb much of this growth. We are also investing in automated wash cycle controls, conveyor-based staging, and barcode-driven inventory management at our Hayward facility. These investments will increase single-facility throughput by approximately 30% without adding headcount. The combined capacity of both facilities will exceed 20,000 totes per year by mid-2027.
Provide Third-Party Verified Environmental Impact Reports
Current: internally calculated and documentedWe are engaging with an independent environmental consulting firm to verify our carbon offset calculations, water savings methodology, and waste diversion data against ISO 14064 (greenhouse gas) and ISO 14046 (water footprint) standards. Once verified, our impact reports will carry third-party assurance statements that clients can reference directly in their ESG disclosures, CDP questionnaires, and GRI reporting.
Expand Community Education to 10 Schools Per Year
Current: ~8 tours per year reaching ~200 studentsWe are developing a standardized curriculum-aligned presentation that teachers can request for field trips. The program includes a 45-minute facility tour, a hands-on tote inspection activity, and a takeaway worksheet on circular economy principles. We are partnering with Hayward Unified School District and Alameda County Office of Education to promote the program to schools across the East Bay.
Join the Circular Economy
Every IBC tote you reuse or recycle with us contributes to a cleaner, more sustainable industrial supply chain. Let us show you how easy it is to make the switch.